| Professional charting tools for .Net developers |
Introducing SharpPlot
Your First Chart
Recent Updates
Sample Charts
General Tutorials
Reference
SharpPlot Class
Properties
Methods
Structures
Enumerations
Style examples
Glossaries
Active Charts
VectorMath Class
DBUtil Class
Get SharpPlot
Download SharpPlot
Buying SharpPlot
SharpPlot Support
Upgrading from GraPL
Release notes
Tutorials > Chart Tutorials > Visualising Response Surfaces
Visualising Response Surfaces
The response surface is generally used with computed data to show a mathematical function of two variables. It may be combined with other 3D charts (typically the cloud chart) to show a theoretical fit in addition to the raw data plotted in 3 dimensions.
A Simple Mesh Surface
The data is an array of arrays of nodes in the surface, which must be strictly rectangular. Each inner array is drawn parallel to the X-axis, working from front to back.
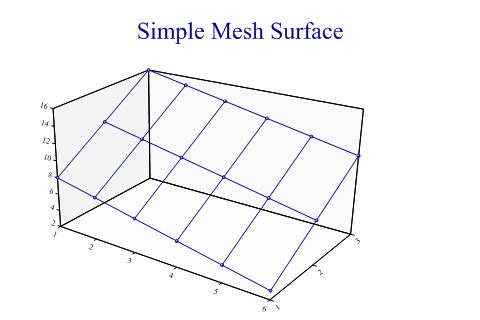
mesh = new int[][]{new int[]{8,7,6,5,4,3},new int[]{12,11,10,9,8,7},new int[]{16,15,
         14,13,12,11}};

sp.SetMargins(48,12,24,0);
sp.Heading = "Simple Mesh Surface";
sp.ResponsePlotStyle = ResponsePlotStyles.WallShading|ResponsePlotStyles.Markers;
sp.SetMarkers(Marker.Node);

sp.DrawResponsePlot(mesh);
Mesh with Given X and Y Co-ordinates
This has the same arrays for the mesh, but the nodes are placed explicitly in both X and Y directions, so the effect is to stretch the surface.
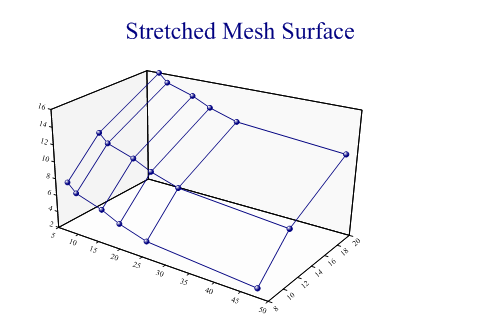
mesh = new int[][]{new int[]{8,7,6,5,4,3},new int[]{12,11,10,9,8,7},new int[]{16,15,
         14,13,12,11}};
xvalues = new int[] {8,10,16,20,26,48};
yvalues = new int[] {8,12,20};

sp.SetMargins(48,12,24,0);
sp.Heading = "Stretched Mesh Surface";
sp.ResponsePlotStyle = ResponsePlotStyles.WallShading|ResponsePlotStyles.Markers;
sp.SetMarkers(Marker.Ball);

sp.DrawResponsePlot(mesh,xvalues,yvalues);
Tiling Two Surfaces
Tiled surfaces are most effectively drawn with semi-transparent fill styles, to allow the axes and any data to show through.
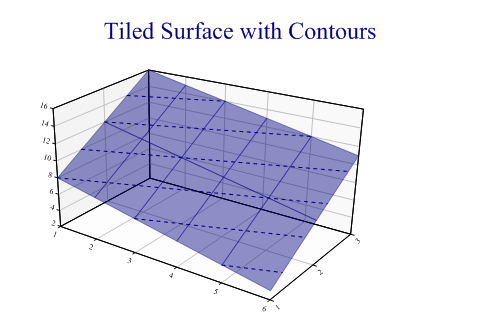
mesh = new int[][]{new int[]{8,7,6,5,4,3},new int[]{12,11,10,9,8,7},new int[]{16,15,
         14,13,12,11}};

sp.SetMargins(48,12,24,0);
sp.Heading = "Tiled Surface with Contours";
sp.ResponsePlotStyle = ResponsePlotStyles.WallShading|ResponsePlotStyles.GridLines|
         ResponsePlotStyles.TiledSurface|ResponsePlotStyles.Contours;
sp.SetFillStyles(FillStyle.Opacity42);

sp.SetContourStyle(Color.Navy,LineStyle.Dash,1.5);

sp.DrawResponsePlot(mesh);
This example shows two intersecting planes, each drawn with 30% opacity.
Altitude Shading
If the mesh genuinely represents ‘altitude’ it can be shaded to represent the range of the Z-axis.
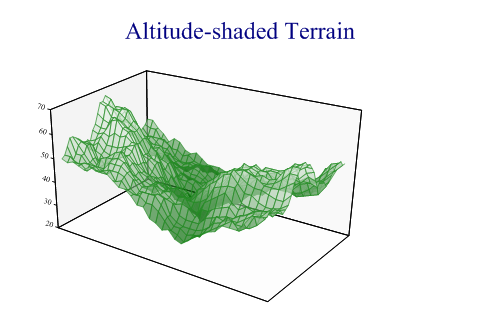
sp.SetMargins(48,12,24,0);
sp.Heading = "Altitude-shaded Terrain";
sp.ResponsePlotStyle = ResponsePlotStyles.WallShading|
         ResponsePlotStyles.TiledSurface|ResponsePlotStyles.AltitudeShading;
sp.XAxisStyle = XAxisStyles.PlainAxis;
sp.YAxisStyle = YAxisStyles.PlainAxis;

sp.SetFillStyles(FillStyle.Opacity66);
sp.SetColors(Color.ForestGreen);

sp.DrawResponsePlot(terrainData);
This works very well with this style of generated fractal landscape.
Summary
The response plot can be a very good way to visualise a computed surface in 3 dimensions.