| Professional charting tools for .Net developers |
Introducing SharpPlot
Your First Chart
Recent Updates
Sample Charts
General Tutorials
Reference
SharpPlot Class
Properties
Methods
Structures
Enumerations
Style examples
Glossaries
Active Charts
VectorMath Class
DBUtil Class
Get SharpPlot
Download SharpPlot
Buying SharpPlot
SharpPlot Support
Upgrading from GraPL
Release notes
Tutorials > Chart Tutorials > Barcharts with an X-Axis
Barcharts with an X-Axis
Barcharts are usually drawn with a ‘logical’ X-axis. However there are times when you want to represent discrete values which occur at particular times. the XBarchart allows you to place bars exactly where you want them, and also to override the normal width for each bar.
Lottery winnings
This is a typical chart when a discrete event occurs occasionally. The data gives the year and value of the data rather than a continuous timeseries with many zero elements.
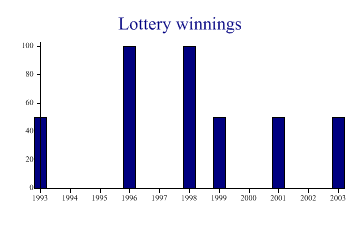
sp.Heading = "Lottery winnings";

year = new int[] {1993,1996,1998,1999,2001,2003};
won = new int[] {50,100,100,50,50,50};

sp.YAxisStyle = YAxisStyles.ForceZero;
sp.DrawXBarChart(won,year);
Using the bar widths to add Information
Supposing we sometimes were very lucky and won twice in the same year.
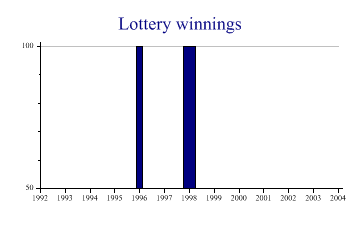
sp.Heading = "Lottery winnings";

year = new int[] {1993,1996,1998,1999,2001,2003};
won = new int[] {50,100,100,50,50,50};
count = new int[] {1,1,2,1,2,1};

sp.SetYTickMarks(50,4);
sp.YAxisStyle = YAxisStyles.GridLines;

sp.SetBarWidths(VectorMath.Multiply(count,0.25));

sp.DrawXBarChart(won,year);
Here the bars are drawn in proportion to the number of wins.
Summarizing Age Bands
The Histogram will summarize data into equal-width groups, and unequal groups may be represented by a filled Stepchart. The XBar offers another alternative here, as the bar-widths can be kept constant regardless of the width of the group.
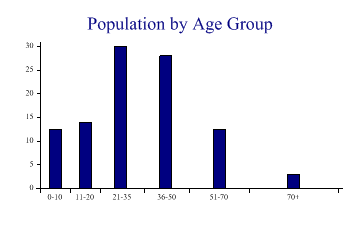
sp.Heading = "Population by Age Group";
sp.XAxisStyle = XAxisStyles.MiddleLabels;
sp.SetXLabels(new string[]{"0-10","11-20","21-35","36-50","51-70","70+"});
sp.SetXTickMarks(new int[] {0,10,20,35,50,70,100});

midpoints = new int[] {5,15,27,42,60,85};
data = new double[] {12.5,14,30,28,12.5,3};

sp.DrawXBarChart(data,midpoints);
This is probably a more accurate view of the data, as the number in each sample is represented only by the height of the bar.
Faking a Grouped/Stacked Barchart
There are occasions when what you really need is a grouped barchart, with one half of the group shown as a stack of bars.
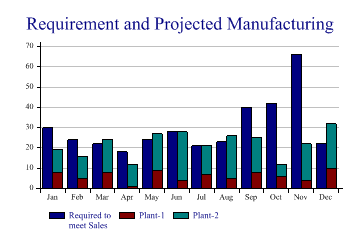
sp.Heading = "Requirement and Projected Manufacturing";

req = new int[] {30,24,22,18,24,28,21,23,40,42,66,22};  // Requirement
prd = new int[][]{new int[]{8,5,8,1,9,4,7,5,8,6,4,10},new int[]{11,11,16,11,18,24,
         14,21,17,6,18,22}};  // Production by Plant

sp.SetXLabels(new string[]{"Jan","Feb","Mar","Apr","May","Jun","Jul","Aug","Sep",
         "Oct","Nov","Dec"});
sp.XAxisStyle = XAxisStyles.MiddleLabels;
sp.YAxisStyle = YAxisStyles.GridLines|YAxisStyles.ForceZero;

// Set barwidth explicitly here so we have exact positioning
sp.SetBarWidths(0.4);

xpos = VectorMath.Sum(0.3,VectorMath.Range(0,12));
sp.DrawXBarChart(req,xpos);

// Now set the style to be cumulative and draw stacked bars beside them ...
sp.DataStyle = DataStyles.Relative;
xpos = VectorMath.Sum(0.7,VectorMath.Range(0,12));

sp.DrawXBarChart(prd,xpos);

sp.SetKeyText(new string[]{"Required to\nmeet Sales","Plant-1","Plant-2"});
This example is typical of a production planning display, where the left-hand bar of each pair shows the total demand in the time period, and the right-hand is split to show supply from various production plants.
Summary
The XBarchart can be used on its own for time-based discrete series, or in combination with other charts to add blocks of color, or to fake particularly complex barcharts.