| Professional charting tools for .Net developers |
Introducing SharpPlot
Your First Chart
Recent Updates
Sample Charts
Tutorials
General Tutorials
Chart Tutorials
SharpPlot Class
Properties
Methods
Structures
Enumerations
Glossaries
Active Charts
VectorMath Class
DBUtil Class
Get SharpPlot
Download SharpPlot
Buying SharpPlot
SharpPlot Support
Upgrading from GraPL
Release notes
Reference > Style examples > Overlayed gridlines
Overlayed gridlines
Draws the gridlines ontop of the data. May be set as ‘style’, ‘xstyle’ or ‘ystyle’ to control the axis grids independently.
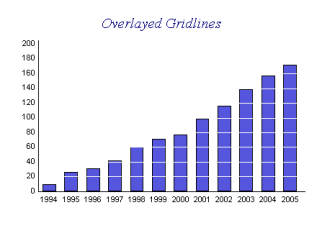
sp.BarChartStyle = BarChartStyles.OverlayGrid;sp.YAxisStyle = YAxisStyles.OverlayGrid;
The example shows a typical barchart from Tufte’s book, using white gridlines to achieve the ‘dissected’ effect he recommends.
See also ...
SharpPlot | BarChartStyle | BoxPlotStyle | GanttChartStyle | LineGraphStyle | PolarChartStyle | ScatterPlotStyle | StepChartStyle | XAxisStyle | XBarChartStyle | YAxisStyle