| Professional charting tools for .Net developers |
Introducing SharpPlot
Your First Chart
Recent Updates
Sample Charts
Tutorials
General Tutorials
Chart Tutorials
SharpPlot Class
Properties
Methods
Structures
Enumerations
Glossaries
Active Charts
VectorMath Class
DBUtil Class
Get SharpPlot
Download SharpPlot
Buying SharpPlot
SharpPlot Support
Upgrading from GraPL
Release notes
Reference > Style examples > Clip to axis range
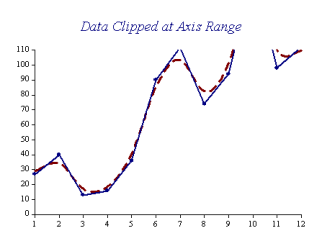
Clip to axis range
This style may be used on the Linegraph or ScatterPlot to remove points outside the span of the axes, and clip any lines at the edge of the chart. Datum lines are also left undrawn if they fall beyond the axes.

sp.YAxisStyle = YAxisStyles.Clipped;
The style may also be used independently on the x and y-axes if required.
Note that if a marker survives clipping (for example it falls right on the boundary) it will normally be drawn completely, along with its value tags, even though these may fall partly outside the axis range. The only exception to this rule is for Framed axes when clipping is strictly to the frame boundary.
See also ...
SharpPlot | LineGraphStyle | ScatterPlotStyle | XAxisStyle | YAxisStyle