| Professional charting tools for .Net developers |
Introducing SharpPlot
Your First Chart
Recent Updates
Sample Charts
Tutorials
General Tutorials
Chart Tutorials
SharpPlot Class
Properties
Methods
Structures
Enumerations
Glossaries
Active Charts
VectorMath Class
DBUtil Class
Get SharpPlot
Download SharpPlot
Buying SharpPlot
SharpPlot Support
Upgrading from GraPL
Release notes
Reference > Style examples > Cells style
Cells style
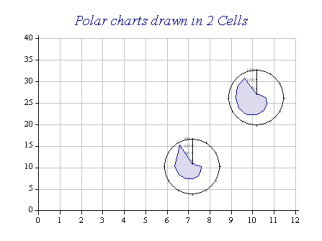
Creates a collection of rectangles (using the current cellsize) centred around each plotted point. These can then be used by sp.NewCell which will use each cell in turn as the chart frame.

sp.LineGraphStyle = LineGraphStyles.CellsCreated;
This allows you to make a scatter-plot of miniature charts, for example using geographical co-ordinates to show details of samples taken at various locations.
See also ...
SharpPlot Members | LineGraphStyle Property | ScatterPlotStyle Property