| Professional charting tools for .Net developers |
Introducing SharpPlot
Your First Chart
Recent Updates
Sample Charts
Tutorials
General Tutorials
Chart Tutorials
Reference
SharpPlot Class
Properties
Methods
Structures
Enumerations
Style examples
Glossaries
Active Charts
VectorMath Class
DBUtil Class
Get SharpPlot
Download SharpPlot
Buying SharpPlot
SharpPlot Support
Upgrading from GraPL
Release notes > Version 2.0 from March 2009
Version 2.0 from March 2009
Availability
Available from CUSP site from March 31st 2009.
New capabilities
Metafile output – extra overloads added to RenderMetafile which take a Stream and simply write to that, rather than creating a stream internally and using it to capture the EMF content.
Stepcharts – get a key placeholder with a little step in it to help discriminate these from ordinary lines. Set as internal type 3 and generally treated just like lines.
ModelSpan – new property allows user to restrict a modelfit to a selected X-range. Could be used to fit several discrete models to a series with an obvious change of slope. The default is still to project the fit across the entire x-axis, so used EquationStyle ‘SpanData’ to get the model shown only within the window set by the span.
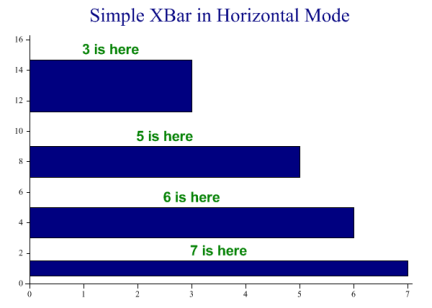
XBar – now takes the ‘Horizontal’ style to fall into line with Bar, Step and VLine plots. This example uses Gantt-style labelling – the default is to label at the right-hand end of each bar.
Gridlines – adds XGridLines and YGridlines as vector settings to allow complete control over grid placement. Any lines drawn outside the first and last ticks are killed off just in case. Setting the grid does not force the axis range to span the extremes – grid lines behave differently from tickmarks and datum lines in this respect.
Fixed bugs and minor tweaks
MinMax – failed with three arrays, all empty. Now just runs through and draws nothing.
PageMap – new call to get a map of the chart that an application can use to track the cursor, pick up hints and tips, and so on. See documentation for details. Several tests check it out.
Key wrapping – legend text did not auto-wrap if the legend was placed explicitly with DrawKey. Now it wraps into the page width (incl the right margin) less any space needed to box the key.
Linespacing – the number that you give here is interpreted as absolute,percent or relative depending on how it relates to the fontsize. If you definitely want absolute, you can set a -ve number to bypass the choice, so setting -3 on a 7pt font would give you 3pts of interline space rather than 21pt.
Curves+SurfaceShading – the recent improvement to the way surfaces are edged bypassed the curves and failed to fill the area at all. Fixed.
Chart titlebar – was getting reset by calls to NewFrame so the last chart set the default title and the user’s setting could be wiped if it was set too early. Now the user’s setting always wins and the first heading encountered fixes the title otherwise.
Vertical text – was now handling HTML tagging so superscript etc was not working in PDF and other formats which don’t support tagged content directly. Fixed.
Legend width – the placeholder for a custom line with a very short total dash-repeat was drawn with room for exactly one repeat cycle, rather than snapping up to the normal default width. Fixed.
Key box – this was setting the lower bound a little too far away from the X-axis so vertical keys ran out of space when there was clearly room for one more row. Fixed. Also the amount of corner-rounding was over-generous on small charts – now reduces with the font size. Notes also. TextSuite 2 tests it. Wrapped text – softhyphens were breaking correctly, but did not show as hyphens when used. Fixed.
Key box (again) – if we only had a single key entry, the check for overunning was not performed, so you could write the key anywhere. Now ensures that it is at least falling on the paper. Also if it only just missed (an unboxed key would have fitted) it attempted to draw a zero-sized box with rounded corners – which blew GDI+ out of the water with an argument exception. Fixed.
Autofit keys – were not reducing the inter-item gap in proportion to the reduced font size. Fixed.
Legend text – honours Keystyle NoWrap which turns off wrapping of long lines in vertical keys.
YDatum lines – could be drawn outside the frame unless the y-axis was clipped. Now checks on the available frame and omits any which would be either above or below the frame. Same if we have a baseline which may be vertical if the chart is style=Horizontal and is also now screened out.
Stepchart – if the final point hit the axis (e.g. 2% interest rate) the last line segment was not drawn. Now checks in advance whether we have more x than y values and passes an extra flag.
Xlabels – when rotated by 90 or 270 these now horizontally centre multi-line labels.
Cyrillic text – somewhere in the move to .Net 2 we changed something which caused non-Latin text to wrap and right-align incorrectly in images. Fixed by adding an extra flag in vscan to stop it making the &#nnnn; conversions for simple text (whatever the Unicode value). This means that the raster engine saves the time converting it all back again, and eliminates the root cause of the wrapping and alignment issues. Metrics for basic Cyrillic and basic Greek added to the factory-fitted font cache, as this adds very little overhead and will save a lot of measuring activity in charts with non-Latin labelling.
SaveChartLog – additional flag so we can force this to make the log after the prescan process which is used to clean up output intended for raster and eps. This shows the output of the HTML scanner which resolves tagged text to simple fragments for engines which don’t directly support HTML-style tags.
Table chart – grouped data on the y-axis should use en-dash to split out the groups. Fixed.
Keys – right-aligned legend block (positioned with DrawKey) was incorrectly wrapped when it was placed close (but not adjacent) to the right-hand axis. Fixed.
Legend positioning – adds KeyStyle ‘Baselined’ to give the same positioning as notes. The first line of text takes the position given, rather than allowing for a possible box.