| Professional charting tools for .Net developers |
Introducing SharpPlot
Your First Chart
Recent Updates
Sample Charts
Tutorials
General Tutorials
Chart Tutorials
SharpPlot Class
Properties
Methods
Structures
Enumerations
Glossaries
Active Charts
VectorMath Class
DBUtil Class
Get SharpPlot
Download SharpPlot
Buying SharpPlot
SharpPlot Support
Upgrading from GraPL
Release notes
Reference > Style examples > Parity plot
Parity plot
Forces a ScatterPlot to be drawn with identical x and y axes, and adds a leading diagonal axis with optional tolerance guidelines.
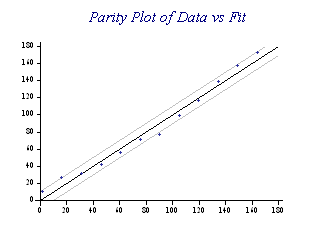
sp.SetMarkers(Marker.Bullet);
sp.ScatterPlotStyle = ScatterPlotStyles.Parity;
sp.Heading = "Parity Plot of Data vs Fit";
sp.ParityTolerance = 10;
sp.ParityStyle = ParityStyles.Absolute;
This chart is generally used to compare a theoretical behaviour with actual data, and to look out for values which exceed some preset tolerance. The limits may be drawn at fixed values (as here) or as percentage or ratio values.